Web Performance Optimisation: hour 1
On Saturday morning, I gave myself a challenge. How much could I improve the performance of one of my websites in 1 hour?
I saw Andy Davies (@andydavies) give an amazing talk on Web Site Performance at Port80 last year, and then took advantage of the half day workshop Andy ran the day before the 2013 Port80 conference.
My two main sources of data for the analysis of the sites performance were http://www.webpagetest.org/ and PageSpeed Insights for Google Chrome – the later being a Chrome Extension that complements the already amazing Chrome Developer Tools.
At the start of my hour, I ran both:
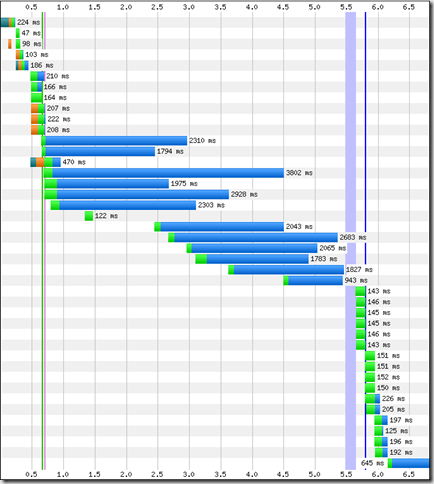
WebPageTest: Fully loaded: 6.8s , request 42, bytes in: 3427 KB
PageSpeed score 79/100.
PageSpeed’s initial suggestions being that I should address these items first: Optimize images, Leverage browser caching, Serve scaled images.
Clearly those long blue bars were an area ripe for improvement.
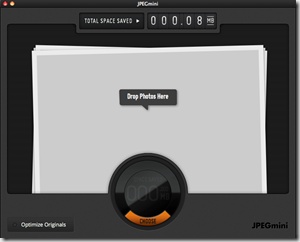
There are a stack of image optimisation tools around, and at some point I need to do a much deeper dive. But within my tight timeframes, I opted to try out JPEGmini and ImageOptim
The main page of the site in question (a luxury cottage available for rent) has a heavy emphasis on the rich visuals of this stunning property, using a jQuery based image slider to rotate through 10 beautiful images.
JPEGmini (for JPGs) knocked around 3MB of the sites slider based image assets (not all of which are on the main page).
Rerunning webpagetest, I now get:
Fully loaded: 4.4s , requesst 42, bytes in: 1555 KB
I then ran JPEGmini, and ImageOptim (for the site’s PNGs) against the rest of the image assets across the site.
Next was the odd image I was resizing within the HTML (for no good reason), so I fixed them in Photoshop – this removed one of the PageSpeed medium level priorities.
Next target was to “leverage browser caching”. Which I approached through updates to my .htaccess files.
Top Mac Tip: I use DeskUtility to make invisible files such as .htaccess visible. If it wasn’t for discovering this tool in recent weeks, I suspect this would have wasted a moderate amount of my performance hour.
** Another top tip from Andy Davies: look at the .htaccess from HTML5 Boilerplate. https://github.com/h5bp/html5-boilerplate
As I have further changes I plan to make to the site, I eased into my browser caching/expires header with a default of “access plus 1 hour” and then overrode the assets types that I knew I would be tweaking in the near future, so wanted to leave well alone.
My changes were as follows (BUT PLEASE DO YOUR OWN RESEARCH BEFORE CHANGING ANY OF YOUR SETTINGS – you can make a real mess of your site)
# ——————————————————————————
# Expires headers (for better cache control)
# ——————————————————————————
ExpiresActive on
ExpiresDefault “access plus 1 hour”
# HTML
ExpiresByType text/html “access plus 0 seconds”
# Media
ExpiresByType image/gif “access plus 0 seconds”
ExpiresByType image/jpeg “access plus 0 seconds”
ExpiresByType image/png “access plus 0 seconds”
PageSpeed was now up to 88/100
I had a low warning:: specify a character set in the HTTP header. so I also added the following to my .htaccess:
————————————————————————–
# UTF-8 encoding
# ———————————————————————–
# Use UTF-8 encoding for anything served as `text/html` or `text/plain`.
AddDefaultCharset utf-8
PageSpeed also had an action for me to :: enable compression
So I again borrowed from HTML5 boilerplate:
# ———————————————————————
# GZIP compression
# ———————————————————————
AddOutputFilterByType DEFLATE application/atom+xml \
application/javascript \
application/json \
application/rss+xml \
application/vnd.ms-fontobject \
application/x-font-ttf \
application/x-web-app-manifest+json \
application/xhtml+xml \
application/xml \
font/opentype \
image/svg+xml \
image/x-icon \
text/css \
text/html \
text/plain \
text/x-component \
text/xml
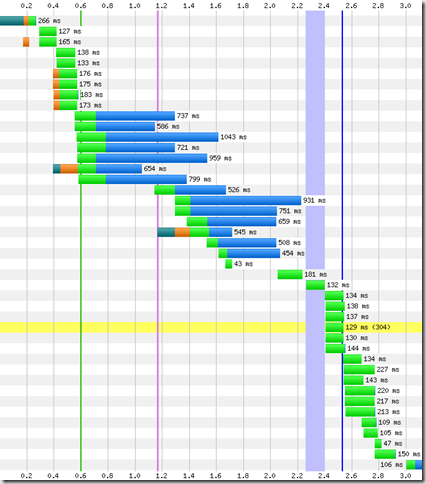
Reran webpagetest:
Fully loaded: 3.121s , request 43, bytes in: 1077 KB
PageSpeed had a low of: javascript deferred loading
So I moved some of my js lower in the page, and made sure I was using the newer asynchronous Google Analytics code. But more optimal javascript is definitely an area I need to come back to, especially getting that jQuery slider to do some lazy loading, and reducing the overall time to glass.
Minor tweak:: minify CSS
At this time I am manually using the code generated by PageSpeed itself, and also am looking forward to improving my overall coding/build/deploy system – one day soon.
Minor Tweak : minify HTML
Again, manually using the pagespeed generated version, saves a rather tiny 600B – but what the heck.
At the end of my allotted hour, I reran webpagetest :
Fully loaded: 2.780s , requests 43, bytes in: 1077 KB
(This was the best load time I saw on WebPageTest – other results were up to and around 3.1s)
After a rather enjoyable and satisfying first hour:
Fully loaded time : down from 6.8s –-> 3.0s
Page weight: down from 3427 KB –>1077KB
PageSpeed score up from 79/100 –> 88/100
All in all, an hour well spent, I just can’t figure out why I’ve not done it before — Thanks Andy 
